


Submit Request
Rest assured, your privacy is paramount to us. The information you provide will be treated with the utmost confidentiality and used exclusively for investment-related communications. We will never share your data with third parties without your consent.
Thank you for considering Atrani Capital for your investment needs. We look forward to connecting with you soon to explore the wealth of opportunities that can benefit us both.

Atrani Monthly magazine
Investors journey - 3, March-April 2026
Good afternoon, dear readers,
We are pleased to present our new issue, featuring three insightful articles:
We hope you find it interesting and valuable. We would be happy to hear your feedback — feel free to write to us at clients@atranicapital.com.
We are pleased to present our new issue, featuring three insightful articles:
- Midterm Elections and Market Cycles — is there a connection, and what is it?
- Two years since the launch of the Bitcoin ETF — how has the instrument performed and what has changed?
- April 2026 Bank of America Global Fund Manager Survey — what are fund managers saying?
We hope you find it interesting and valuable. We would be happy to hear your feedback — feel free to write to us at clients@atranicapital.com.
Midterm Elections and Market Cycles
U.S. equities tend to follow a recognizable but often misunderstood pattern around midterm elections, but the underlying statistics show both persistence and important dispersion. Over the past 125 years (31 midterm cycles), the S&P 500 has delivered an average return of 2.9% in the 12 months before midterms, materially below its long-term annual average of 8.9%, before rebounding to 12.4% in the 12 months after the vote. In more recent decades (post-1980), the asymmetry has been even more pronounced, with returns of roughly 8.7% before vs. 17.5% after, suggesting a stronger post-election risk-on dynamic in the modern monetary-policy regime.
Table 1: Historical U.S. stock market returns
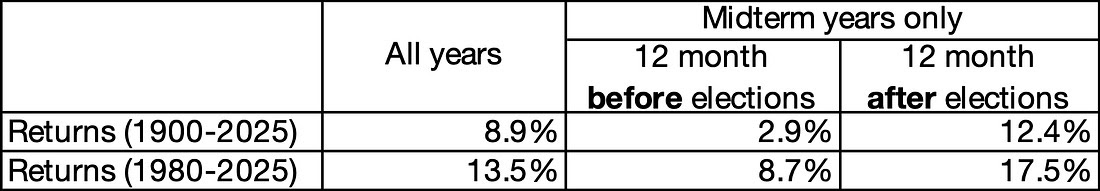
Sources: U.S. Bank Asset Management Group Research, Bloomberg; U.S. stock market as represented by the Dow Jones Industrial Average from 1900-1928, and the S&P 500 from 1929-2025.
The pre-election weakness is closely tied to elevated uncertainty, but the magnitude of moves is often underappreciated. Longview Economics’ dataset, covering 25 midterm cycles since 1926, shows an average peak-to-trough drawdown of -19.4% in the year before elections. Excluding periods that fell within roughly a year on either side of a recession, 12 of 16 cycles still experienced corrections greater than 10%. Within that, 7 out of 12 major drawdowns exceeded 20%, highlighting that midterm-related volatility frequently overlaps with meaningful repricing episodes rather than shallow pullbacks. This helps explain why the pre-midterm period often feels disproportionately weak relative to headline macro data.
Table 2: S&P 500 performance before and after US midterm elections
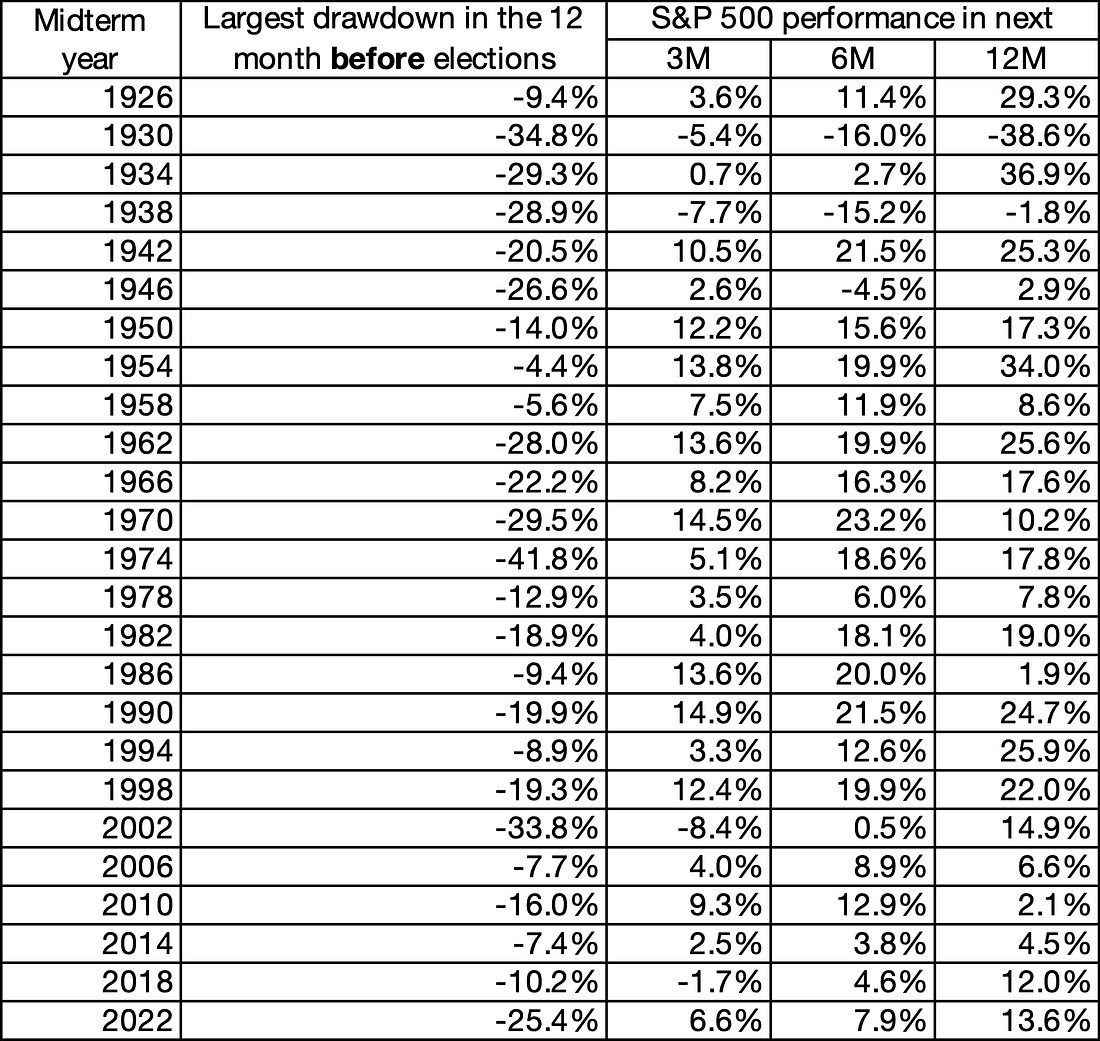
Source: Longview Economics.
The post-midterm phase, by contrast, exhibits a much tighter clustering of positive outcomes. Average returns reach 5.7% over 3 months, 10.5% over 6 months, and 13.6% over 12 months, with only 2 negative 12-month periods (1930 and 1938) — both occurring during extreme macro stress tied to the Great Depression. Moreover, there is a loose positive relationship between the size of the pre-midterm drawdown and the subsequent recovery, suggesting that deeper corrections tend to reset valuations and position markets for stronger rebounds, although this relationship is not statistically robust.
A critical nuance emerges when expanding the sample and isolating macro drivers. U.S. Bank’s broader study finds that in 11 out of 31 midterm cycles (~35%), weak pre-election performance was primarily driven by non-political shocks — including inflation spikes (1970, 2022), aggressive rate hikes (1966, 1980s regimes), recessions (1930, 2002), or geopolitical events. The dispersion of outcomes is wide, with pre- and post-midterm returns ranging from losses exceeding -30% to gains approaching +50%, which dilutes the statistical significance of the average pattern. Formal testing (t-statistics) indicates that the difference between midterm and non-midterm periods is not statistically significant, reinforcing that elections themselves are not a reliable causal driver.
Table 3: Midterm election years with poor performance related to non-election catalysts
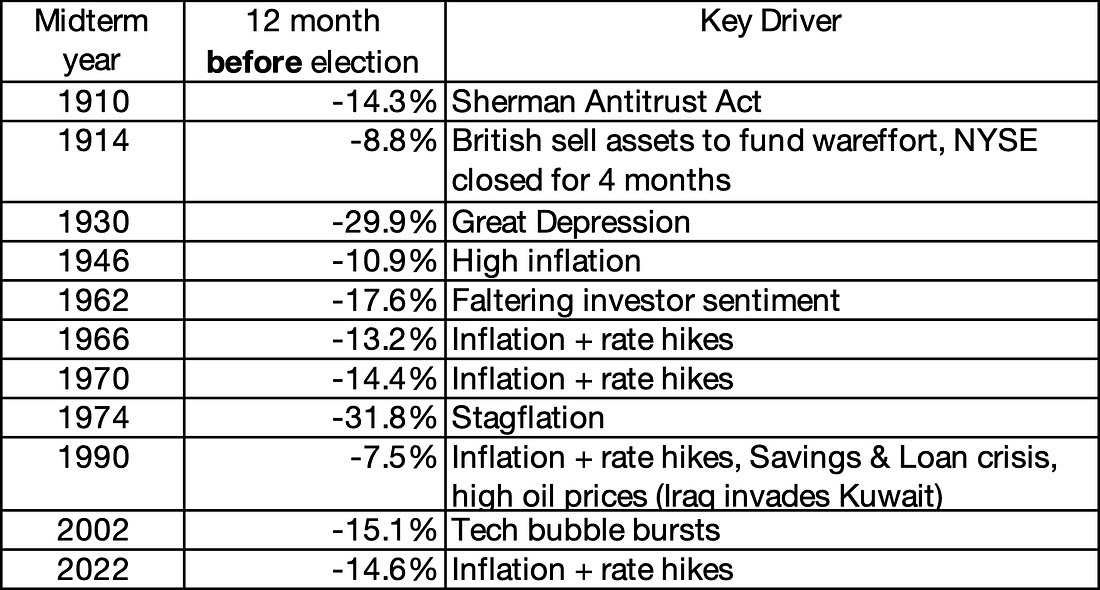
Sources: U.S. Bank Asset Management Group Research, Bloomberg. Returns on U.S. large cap stocks in the 12 months leading up to midterm elections.
Taken together, the data suggest that midterms function primarily as a sentiment and volatility cycle embedded within the broader macro regime. The pre-election phase typically coincides with higher equity risk premia, lower forward returns, and increased volatility, while the post-election period reflects uncertainty resolution, improved visibility on policy, and a re-anchoring to fundamentals such as earnings growth, inflation trajectories, and monetary policy. For investors, the practical implication is that midterm cycles can help contextualize timing — particularly identifying periods when risk assets are under pressure — but the direction and durability of returns remain overwhelmingly determined by the macroeconomic backdrop rather than the political calendar.
Bitcoin ETFs Two Years On
It has been more than two years since the launch of the first U.S. spot Bitcoin ETFs, a landmark step that brought direct Bitcoin exposure into the mainstream exchange-traded product market. The launch was widely anticipated because it gave investors access to Bitcoin through a familiar brokerage account rather than through crypto wallets, exchanges, or private trust structures. That makes this a good moment to assess how this market has evolved — and whether they have started to shift crypto from a niche speculative market toward a more institutional and broadly accessible investment category, even if the asset class itself remains highly volatile. The SEC approved the listing and trading of spot bitcoin exchange-traded products on January 10, 2024, marking the formal beginning of this market in the United States.
The path to this market was gradual. The earliest Bitcoin investment vehicles were private or closed-end trusts that held physical Bitcoin and traded over the counter. The largest of them, Grayscale Bitcoin Trust, often traded at a substantial discount to net asset value because, before its January 2024 conversion into an exchange-traded product, it did not operate a redemption mechanism. The next major step came in 2021, when the first U.S. bitcoin futures ETF — ProShares Bitcoin Strategy ETF, or BITO — began trading. Only in January 2024 did U.S. investors gain access to spot products holding actual Bitcoin in an ETF-like wrapper.
The broader crypto ETF universe has expanded quickly since then, but it is important to distinguish between very different categories of products. Today’s lineup includes spot Bitcoin and spot Ethereum funds, futures-based ETFs, leveraged and inverse vehicles, covered-call structures, and diversified crypto baskets. These products all provide some form of crypto-linked exposure, but they differ materially in cost, complexity, risk profile, and how closely they track the underlying asset. For that reason, the most meaningful comparison is still within the spot Bitcoin ETF segment, which remains the core of the market.
Table 1. U.S.-Listed Crypto Exchange-Traded Products (with assets above $100 million)
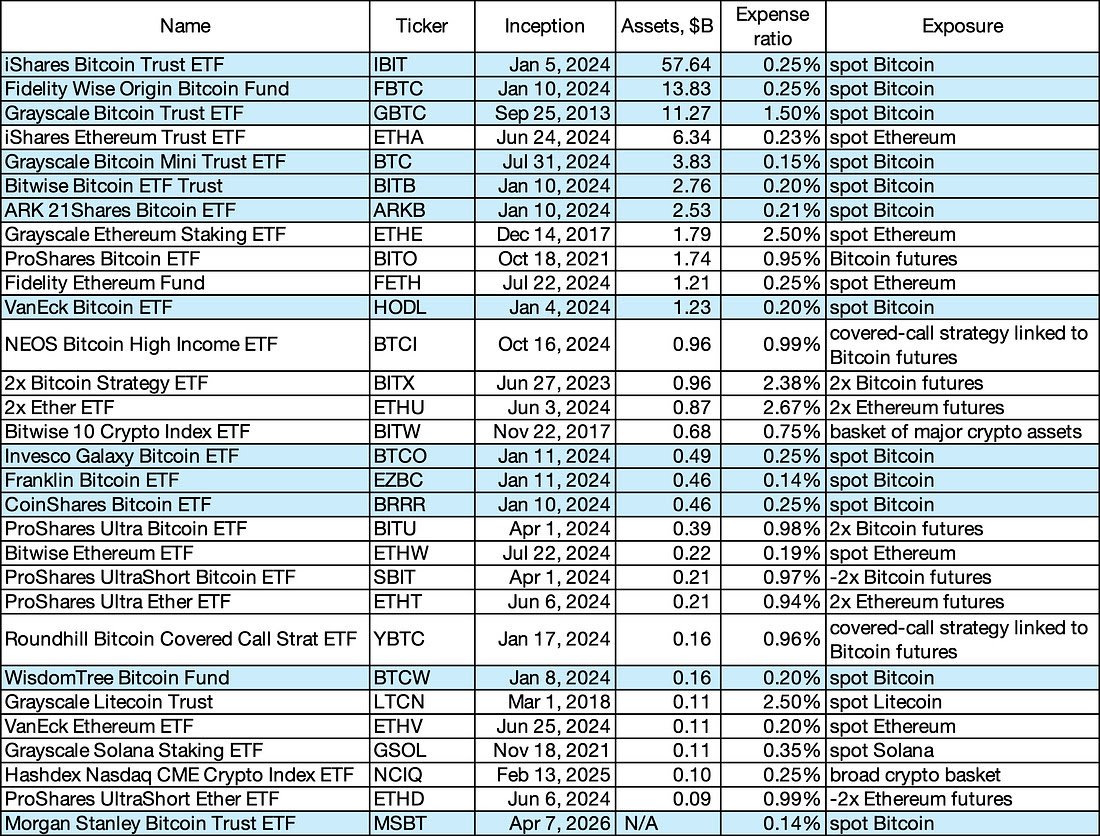
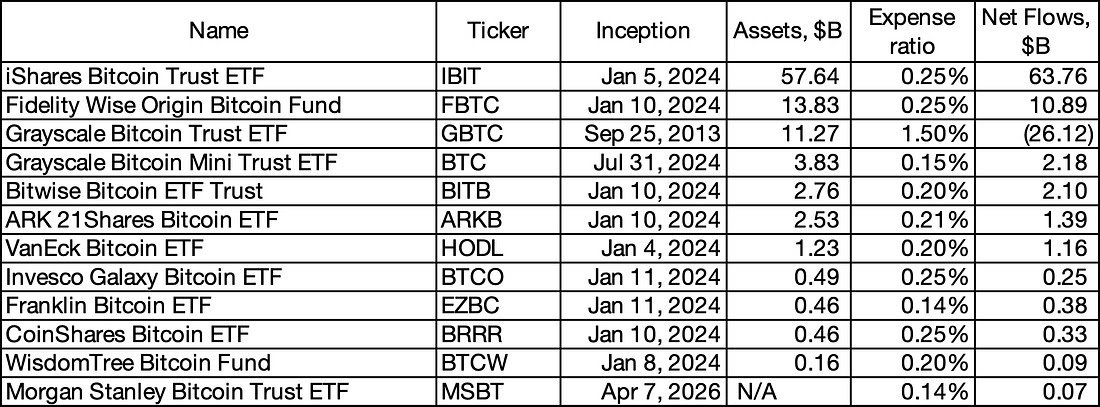
Clearly, spot Bitcoin ETFs offer the most efficient structure on cost, with expense ratios generally clustered in the 0.14%–0.25% range — far below the roughly 1%–2% fee burden that characterized earlier private trusts and still well below the expense ratios of many futures-based crypto vehicles. That fee compression was one of the main reasons the new products rapidly reshaped the market. For investors seeking straightforward Bitcoin exposure inside a brokerage account, spot ETFs delivered a simpler and materially cheaper wrapper than either closed-end trusts or futures-based products, which also face roll-related frictions on top of headline fees.
Flows, however, show that cost alone does not determine success. Capital has been concentrated heavily in IBIT and FBTC, suggesting that distribution strength, issuer reputation, and liquidity matter at least as much as headline pricing. Morgan Stanley’s decision in 2024 to allow its advisers to recommend IBIT and FBTC to eligible clients was an important signal that access through major wealth-management platforms was helping direct demand toward the two largest products. That also helps explain why the relationship between expense ratio and net inflows is far from linear: some low-cost funds have remained relatively small, while GBTC has been the clearest loser, with its much higher fee making it structurally less competitive and contributing to persistent outflows as investors migrated toward lower-cost alternatives.
Table 2. U.S. Spot Bitcoin ETFs: Assets, Fees and Cumulative Flows since launch / conversion
At first glance, the inflows look large and clearly point to strong investor demand. However, two important caveats are needed. First, a meaningful portion of those inflows did not represent entirely new demand for Bitcoin exposure, but rather a migration out of legacy vehicles — above all GBTC — into the new, lower-cost ETF structure. In that sense, part of the headline inflow reflected a reshuffling within the crypto wrapper universe rather than a pure expansion of the investor base. Second, those numbers still need to be judged against the scale of the broader U.S. fund market. Spot Bitcoin ETFs have been commercially successful and highly visible, but they still represent only a very small share of overall U.S. fund assets.
Table 3. Spot Bitcoin ETFs in Context of the U.S. Fund Market
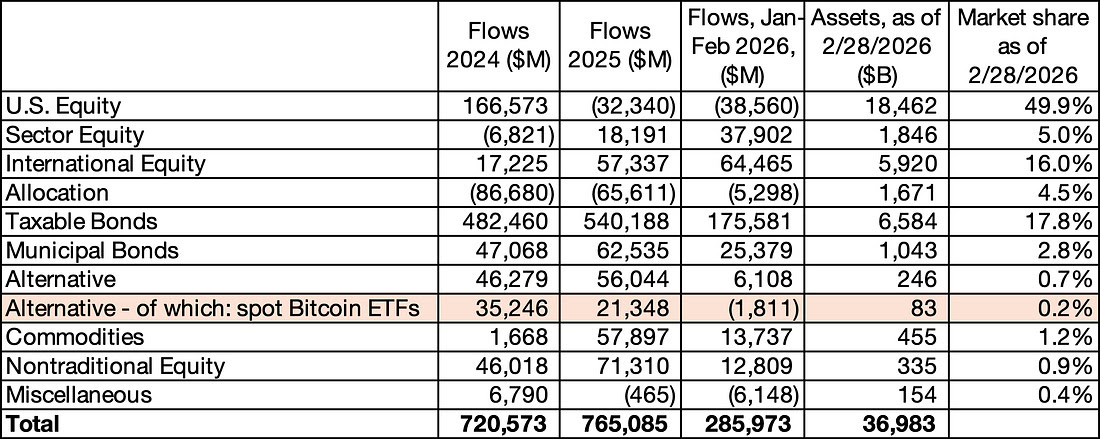
That contrast matters. The category has become too large to dismiss as a niche experiment, but it is still far from large enough to materially reshape the overall U.S. fund landscape. At the same time, the underlying asset is no longer trivial in absolute terms. Bitcoin has grown into a trillion-dollar asset class, which means the ETF wrapper sits on top of something economically meaningful even if portfolio allocations remain modest by traditional asset-management standards. Bitcoin’s market capitalization currently stands near $1.5 trillion, while the S&P 500 represents roughly 80% of total U.S. equity market capitalization and the index’s total market capitalization exceeds $61 trillion.
That caution is reflected in how large asset managers frame portfolio allocation. BlackRock has argued that, in a traditional 60/40 portfolio, a 1%–2% bitcoin allocation is a reasonable range because larger weights would sharply increase overall portfolio risk. VanEck has discussed a disciplined 1%–3% allocation framework, while Fidelity has published analysis suggesting that allocations of 2%–5% could have a meaningful impact under more optimistic adoption assumptions, though not as a universal recommendation for all investors. In other words, even among firms constructive on Bitcoin, the mainstream view still treats it as a satellite exposure, not a core portfolio holding.
For investors, that leads to a practical conclusion. Because the differences in headline expense ratios across spot Bitcoin ETFs are now relatively small, fund selection should not be based on fees alone. In most cases, it makes more sense to focus on large, liquid vehicles with substantial assets, strong secondary-market trading volume, and tight spreads. Bigger funds are generally easier to trade, more suitable for institutional use, and less vulnerable to liquidity frictions than smaller niche products. That is one reason the largest spot Bitcoin ETFs have emerged as the dominant market vehicles, while many smaller funds remain peripheral despite offering similar underlying exposure.
More broadly, Bitcoin ETFs are only one channel through which crypto is entering mainstream finance, alongside stablecoins, tokenized assets, and deeper integration into traditional payment and settlement infrastructure.
April 2026 Bank of America Global Fund Manager Survey
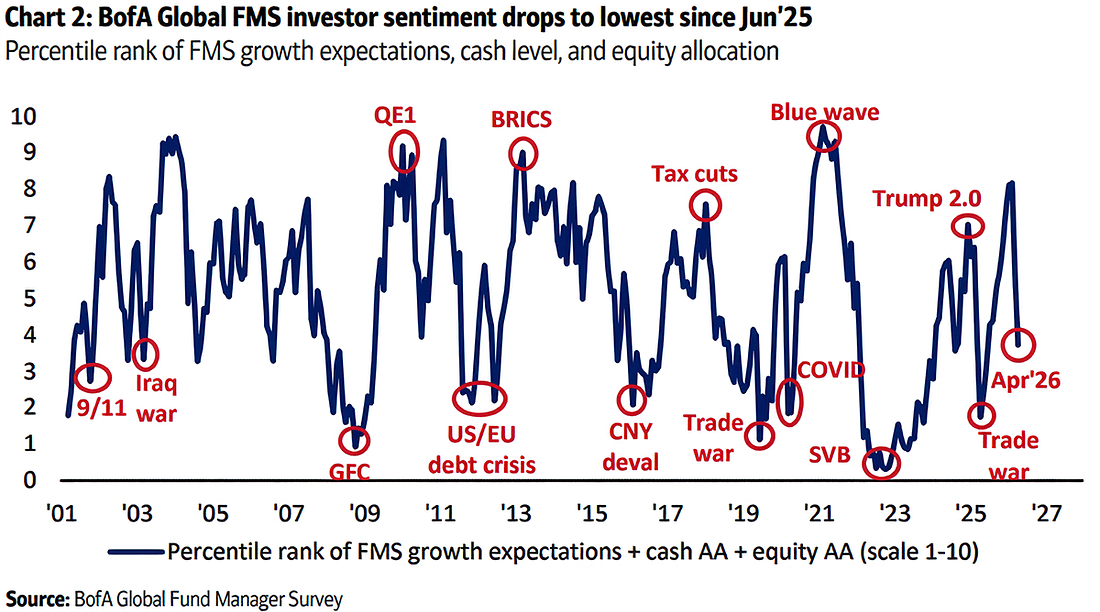
The April Bank of America Global Fund Manager Survey signals a clear break from the optimism that defined recent months, with sentiment deteriorating sharply as investors reassess the macro outlook. The composite indicator dropped to 3.7 from 5.6, the lowest level since June 2025, reflecting a rapid shift toward a more stagflationary narrative.
At the core of this move is a swift repricing of macro risks, triggered in part by the escalation of the U.S.–Iran conflict. The shock has filtered through energy markets, pushing up oil and shipping costs and, in turn, reinforcing inflation pressures. As a result, geopolitics is no longer a background risk—it is increasingly seen as the key driver shaping growth, inflation, and financial conditions simultaneously.
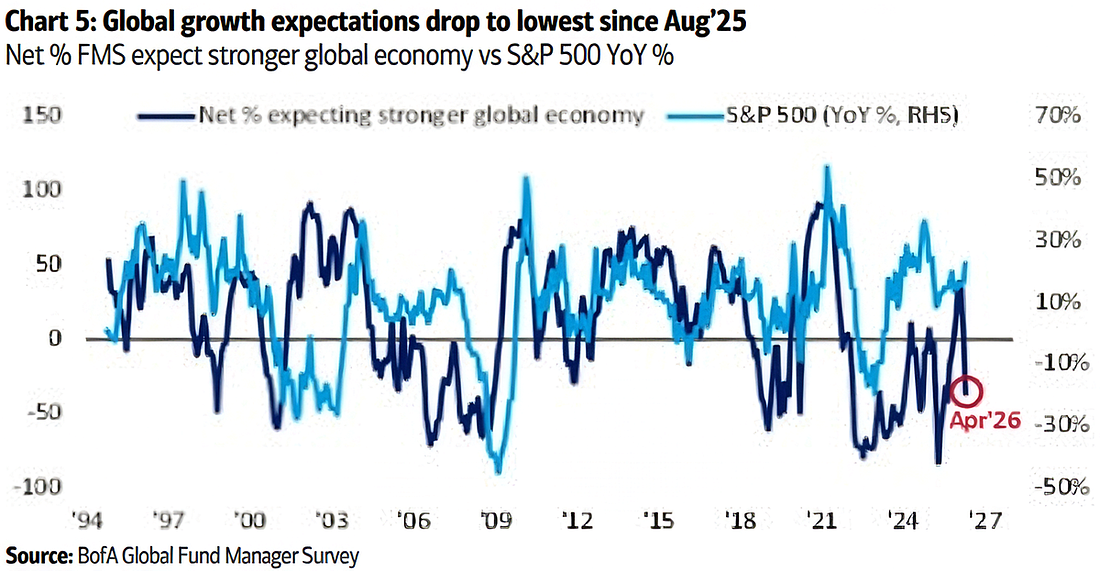
Growth expectations have deteriorated sharply, with a net 36% of investors now expecting weaker global activity, compared with just 7% previously.
Growth expectations have deteriorated sharply, with a net 36% of investors now expecting weaker global activity, compared with just 7% previously.
At the same time, inflation expectations have jumped to a net 69%, the highest since May 2021.
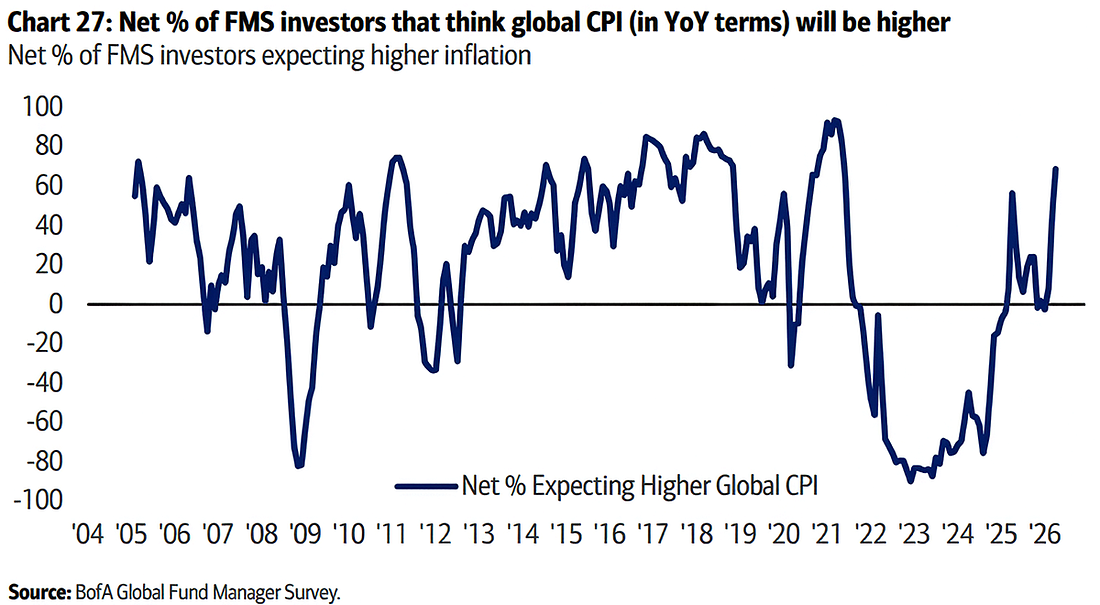
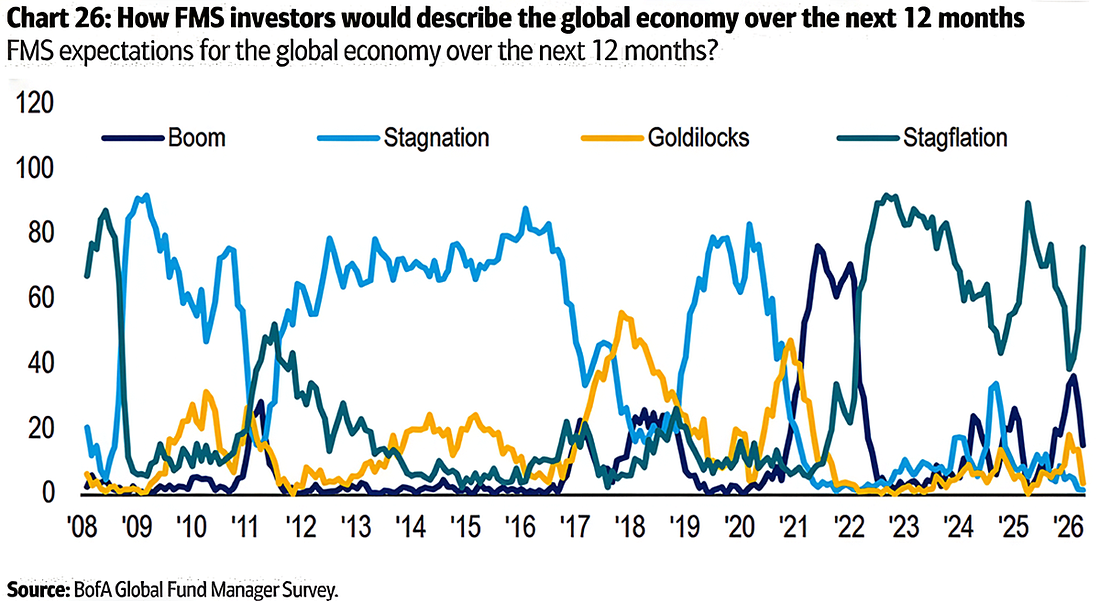
The combination marks a decisive shift away from the disinflationary “Goldilocks” environment toward a more unstable mix of slowing growth and persistent inflation—historically a far more difficult backdrop for risk assets.
That shift is now widely acknowledged: 76% of respondents explicitly describe the current environment as stagflation.
That shift is now widely acknowledged: 76% of respondents explicitly describe the current environment as stagflation.
Even so, investors are not yet bracing for recession. A majority still sees the global economy avoiding a downturn, with 52% expecting a soft landing and 32% a “no landing,” while only 9% anticipate a hard landing.
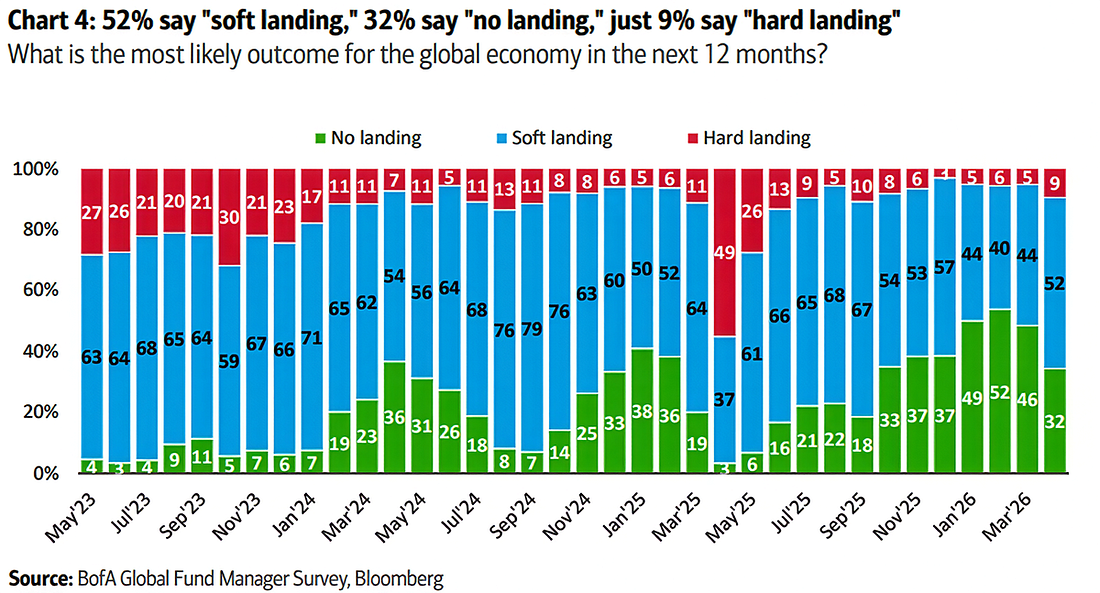
In other words, the base case is not collapse, but something arguably more complicated—growth that slows but does not break, alongside inflation that proves harder to bring down. That combination tends to leave both policymakers and markets in an uncomfortable position.
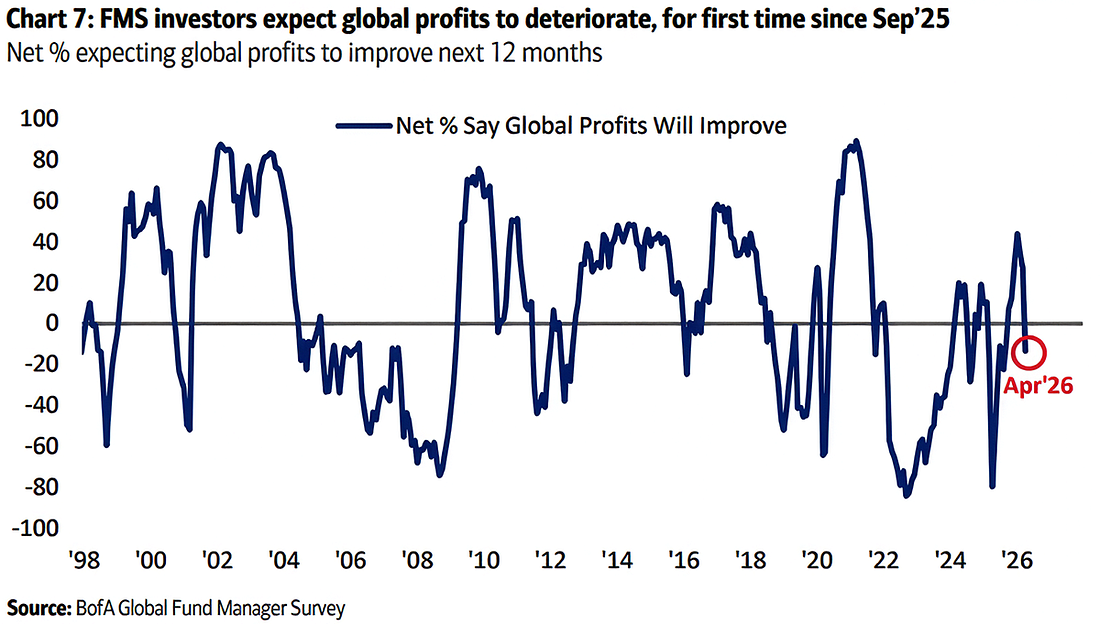
The earnings outlook is already starting to reflect this tension. Profit expectations have turned negative, with a net 14% of managers expecting deterioration, pointing to growing pressure on margins from both higher input costs and softer demand.
The earnings outlook is already starting to reflect this tension. Profit expectations have turned negative, with a net 14% of managers expecting deterioration, pointing to growing pressure on margins from both higher input costs and softer demand.
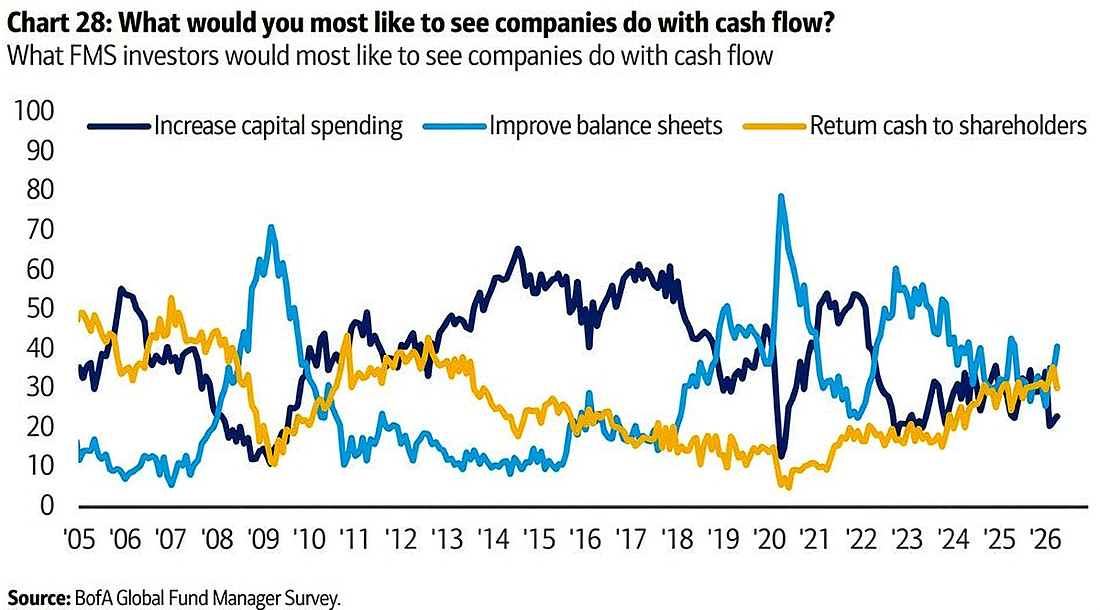
Corporate behavior is adjusting accordingly. Balance-sheet strength is now the top priority for 41% of investors, ahead of shareholder returns (30%) and capital expenditure (23%), suggesting a shift toward resilience rather than expansion.
At the policy level, a growing disconnect is emerging. Inflation expectations are rising,
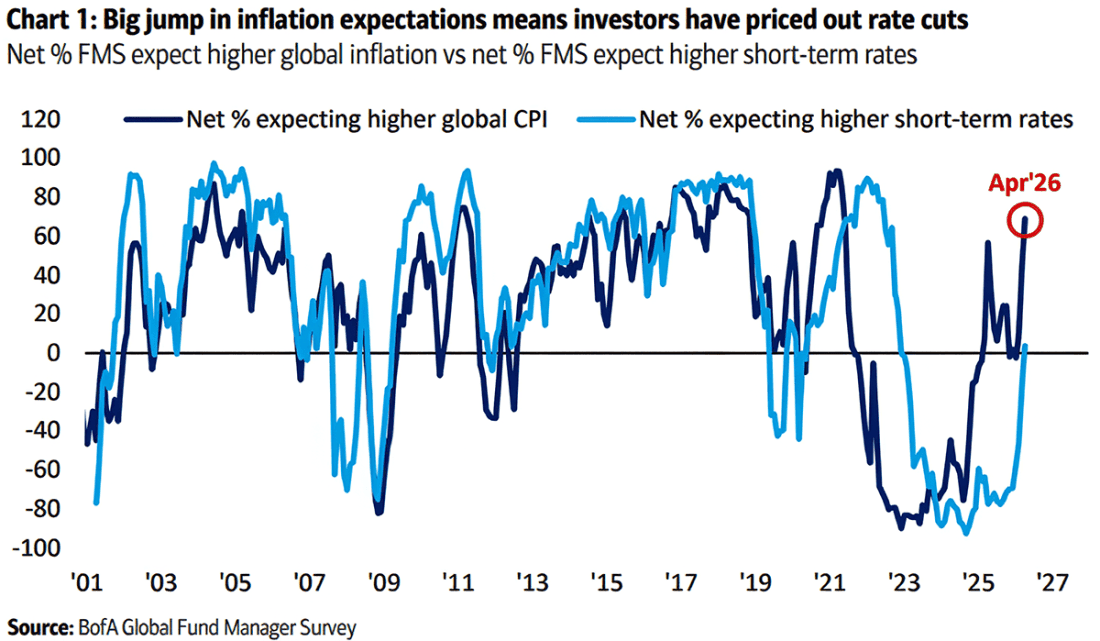
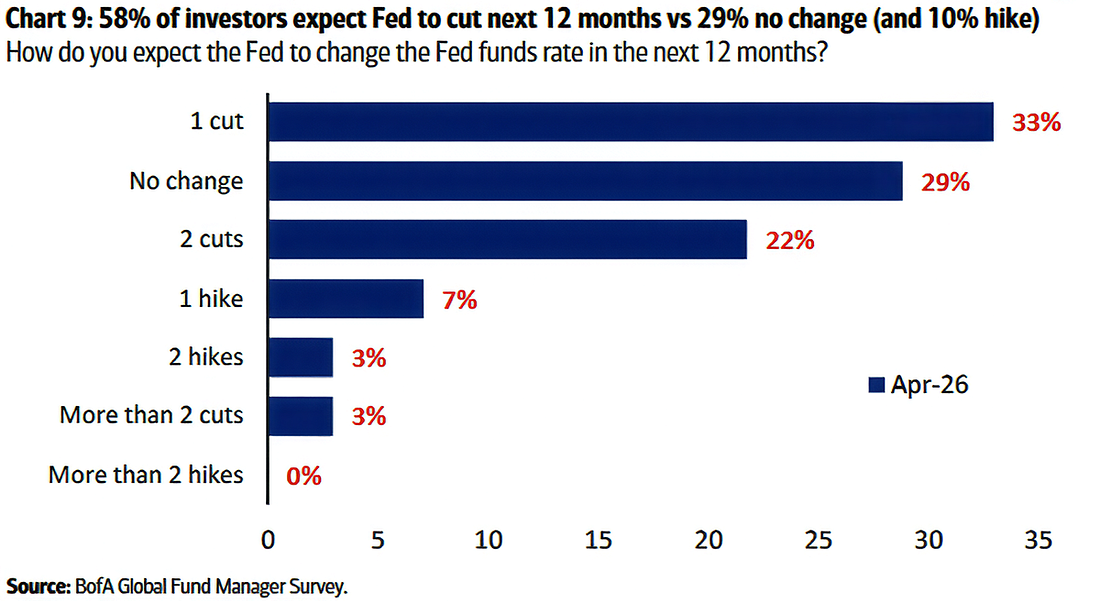
yet markets continue to anticipate easing: 58% of investors still expect Fed rate cuts, while only 10% foresee hikes. This tension implies that investors are beginning to question how much flexibility central banks will actually have if inflation remains elevated.
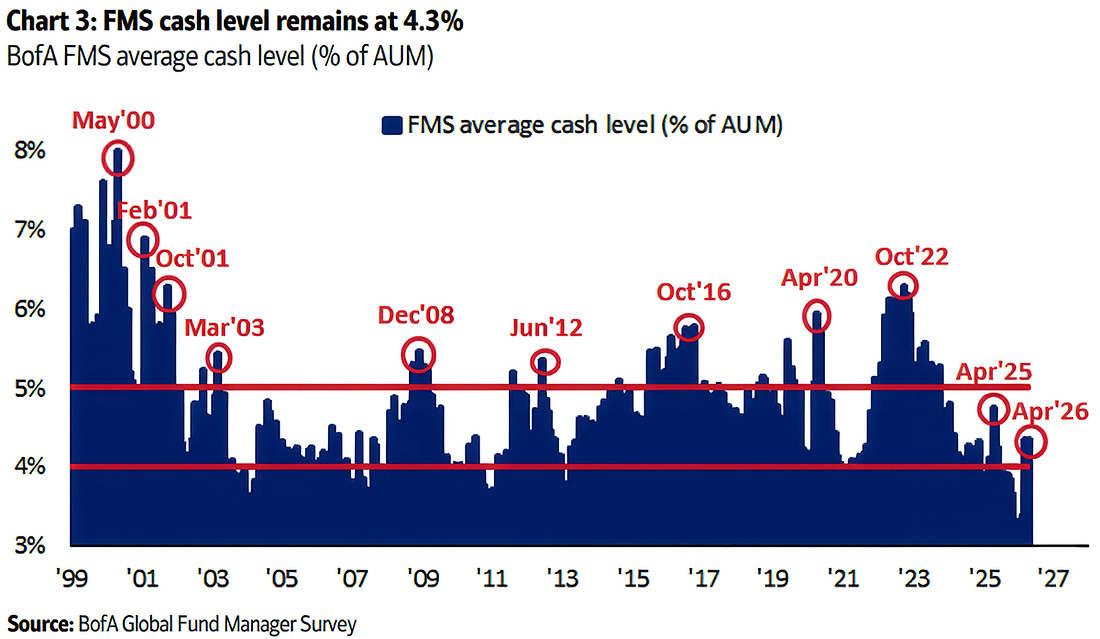
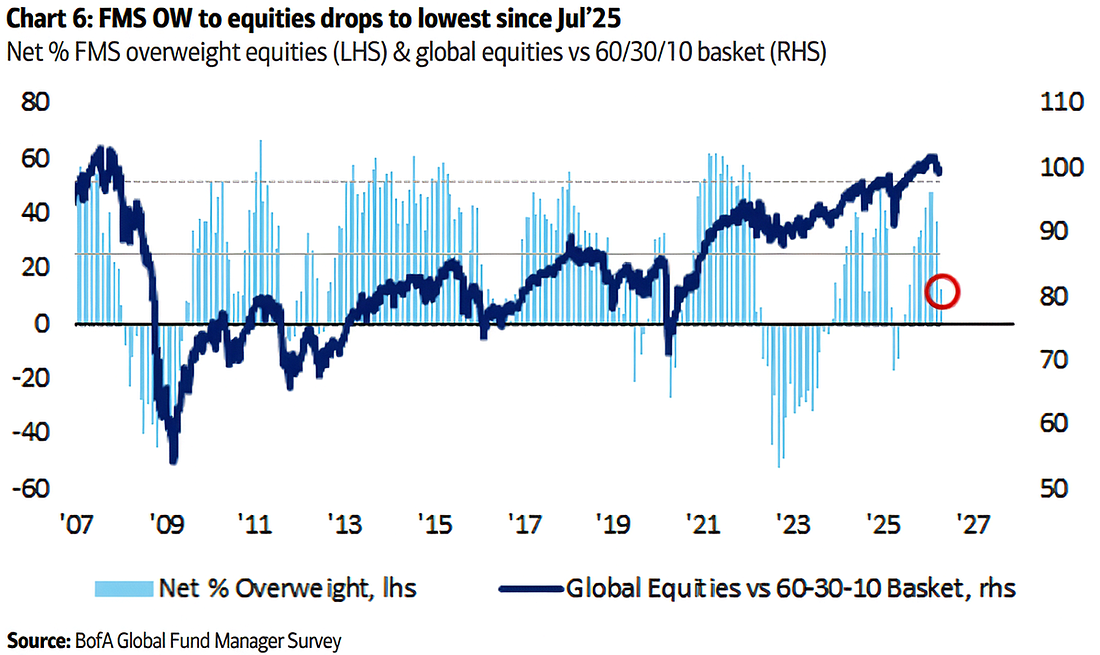
Positioning reflects this more cautious mindset—but stops short of panic. Cash levels held at 4.3%, but allocations jumped to a net 20% overweight from net 8% overweight, signaling a meaningful rebuilding of defensive buffers.
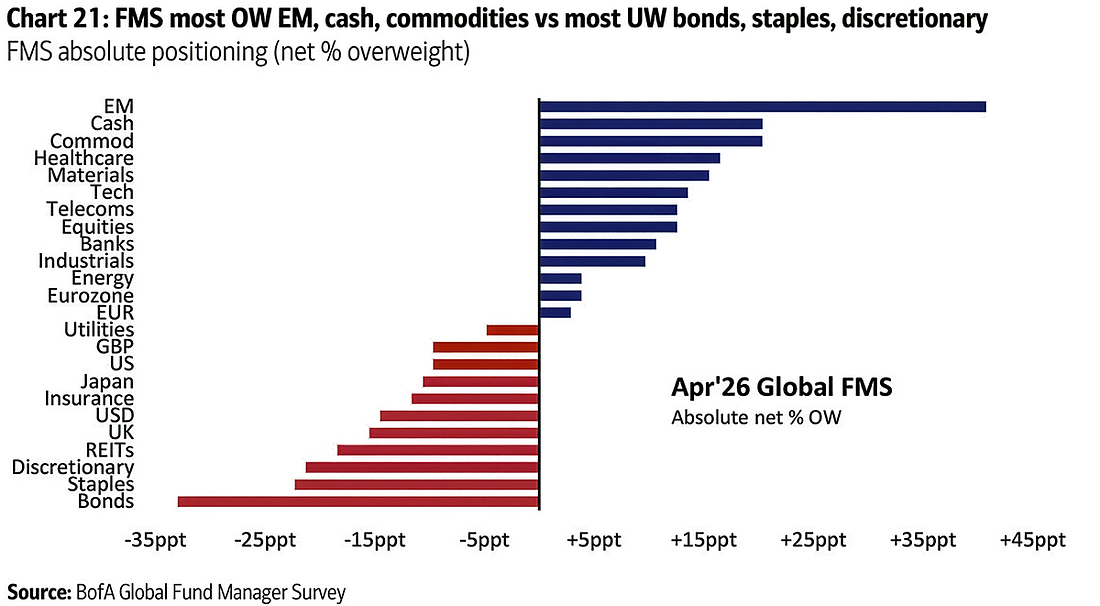
Equity exposure has been reduced, though remains elevated at a net 13% overweight, while bonds continue to be heavily underweight, highlighting an ongoing reluctance to add duration risk.
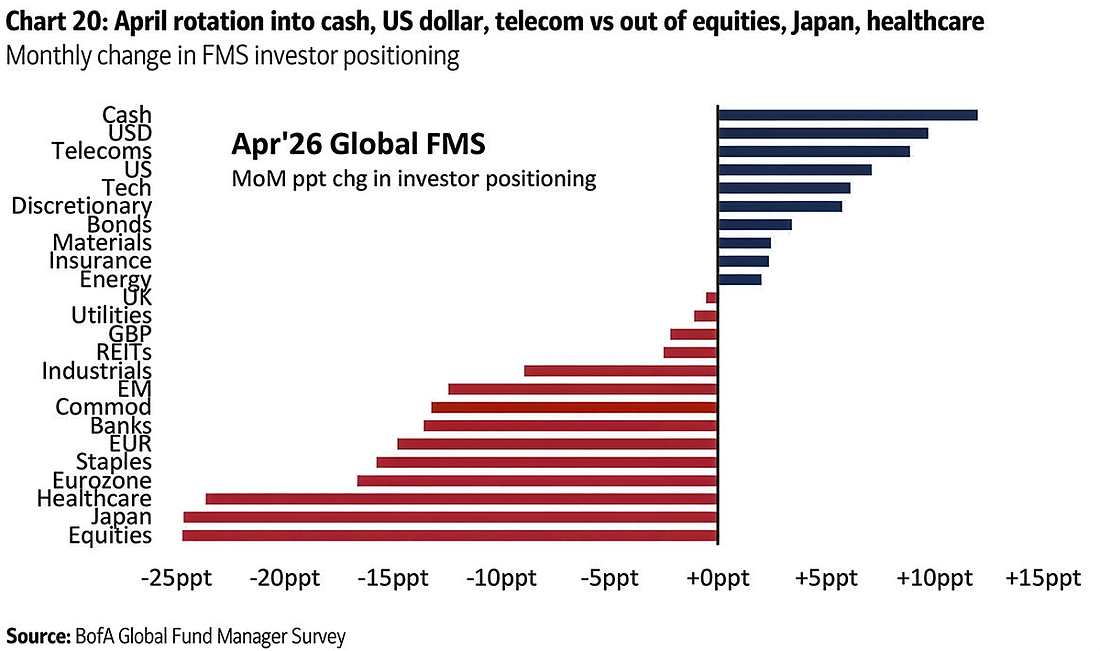
Commodities, while trimmed, remain a key part of portfolios. Exposure eased to a net 20% overweight but continues to reflect demand for inflation hedges. Flows tell a similar story: investors are rotating out of equities and cyclical exposures into cash, the U.S. dollar, and more defensive sectors, suggesting a repositioning rather than a wholesale exit from risk.
In that sense, what we are seeing is a recalibration, not capitulation. Investors are stepping back, but not yet bracing for a full risk-off regime.
Regionally, the adjustment is selective. Emerging markets remain the largest overweight of 41%, even after reduction from 53%, while Japan saw one of the sharpest reversals in positioning to a net 11% underweight from a net 14% overweight. Eurozone exposure has been cut significantly to a net 4% overweight from net 21% overweight, and U.S. equities, though still underweight at 10%, have stabilized somewhat. This pattern points to increasing differentiation rather than a uniform retreat from risk.
Regionally, the adjustment is selective. Emerging markets remain the largest overweight of 41%, even after reduction from 53%, while Japan saw one of the sharpest reversals in positioning to a net 11% underweight from a net 14% overweight. Eurozone exposure has been cut significantly to a net 4% overweight from net 21% overweight, and U.S. equities, though still underweight at 10%, have stabilized somewhat. This pattern points to increasing differentiation rather than a uniform retreat from risk.
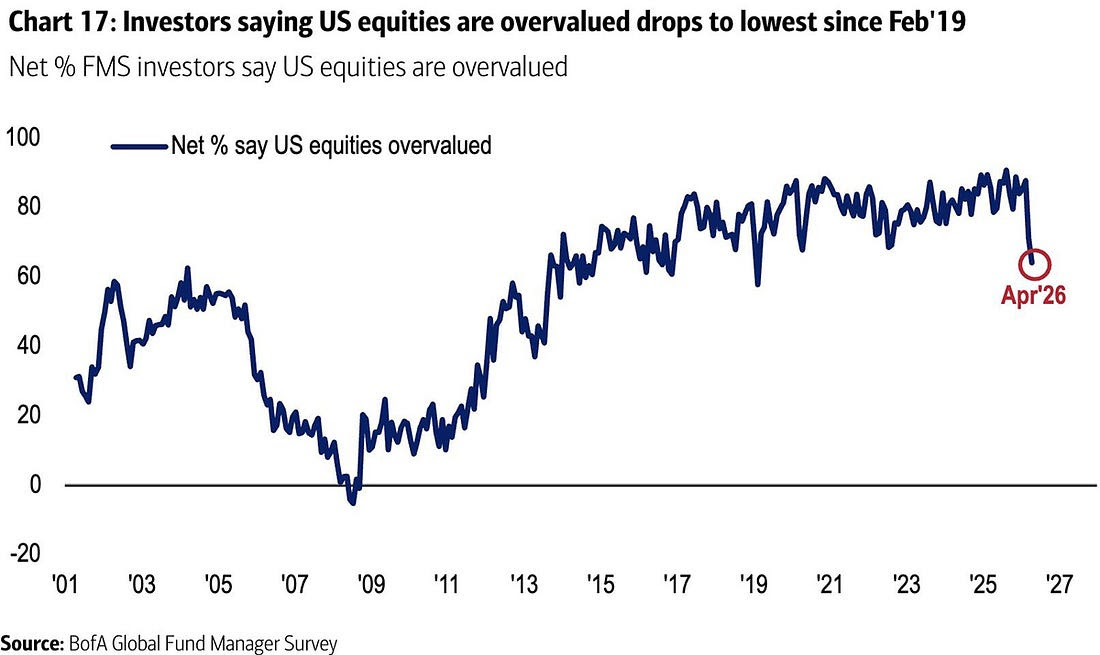
At the same time, valuation concerns—particularly in the U.S.—remain elevated, even if they have eased to the lowest level since February 2019.
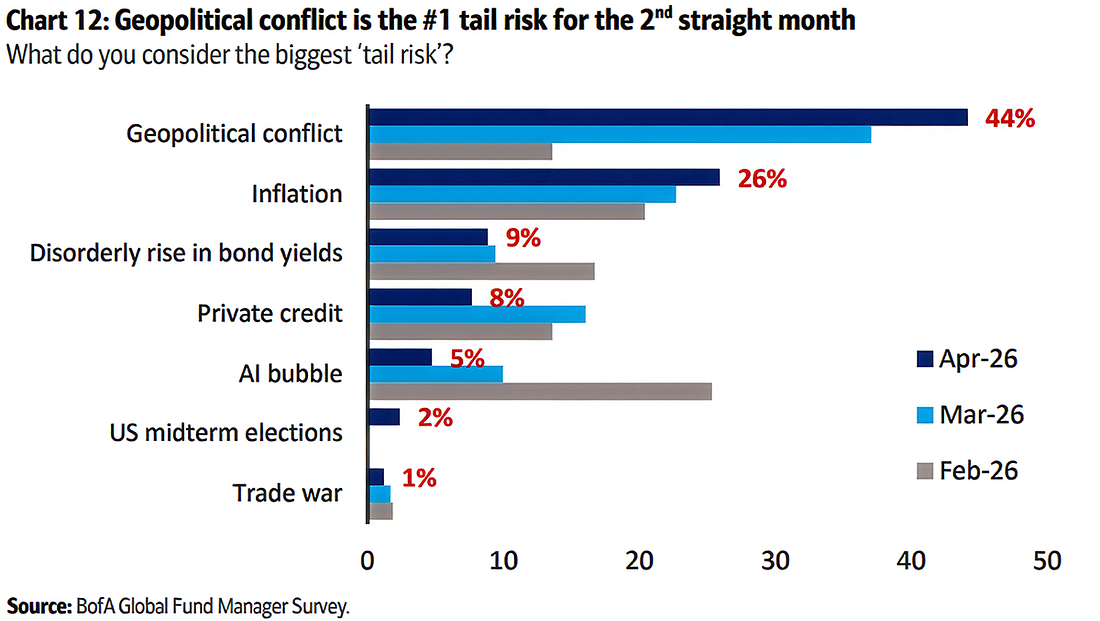
Risk perception has shifted decisively. Geopolitics now dominates, cited by 44% of respondents, followed by inflation and bond yields.
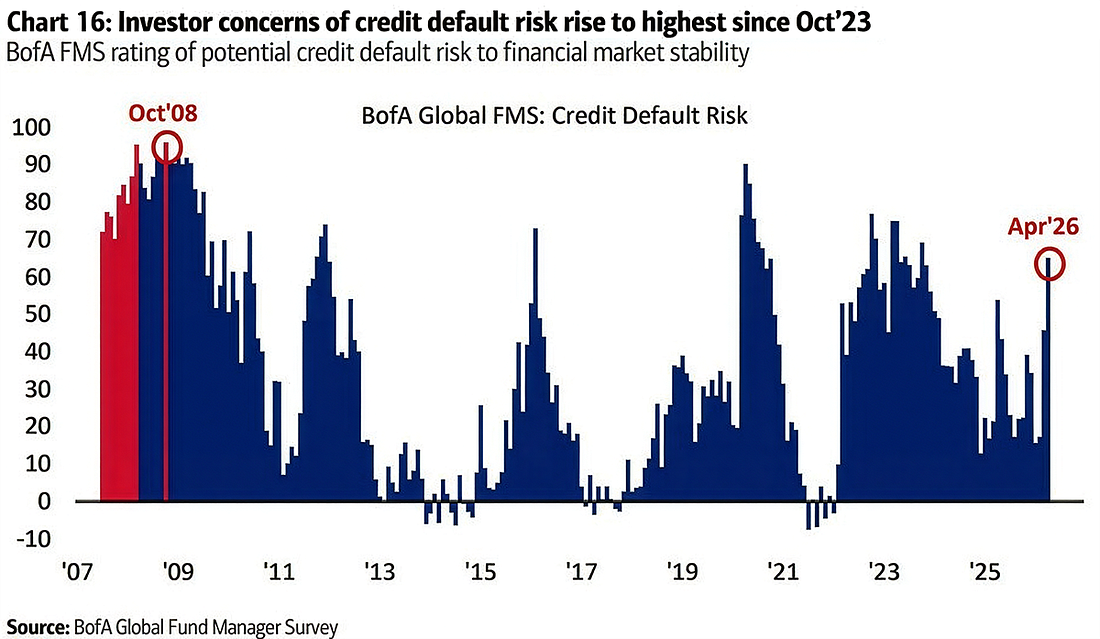
Concerns about credit are also building, with default-risk expectations rising to their highest level since late 2023, suggesting growing unease beneath the surface of the financial system.
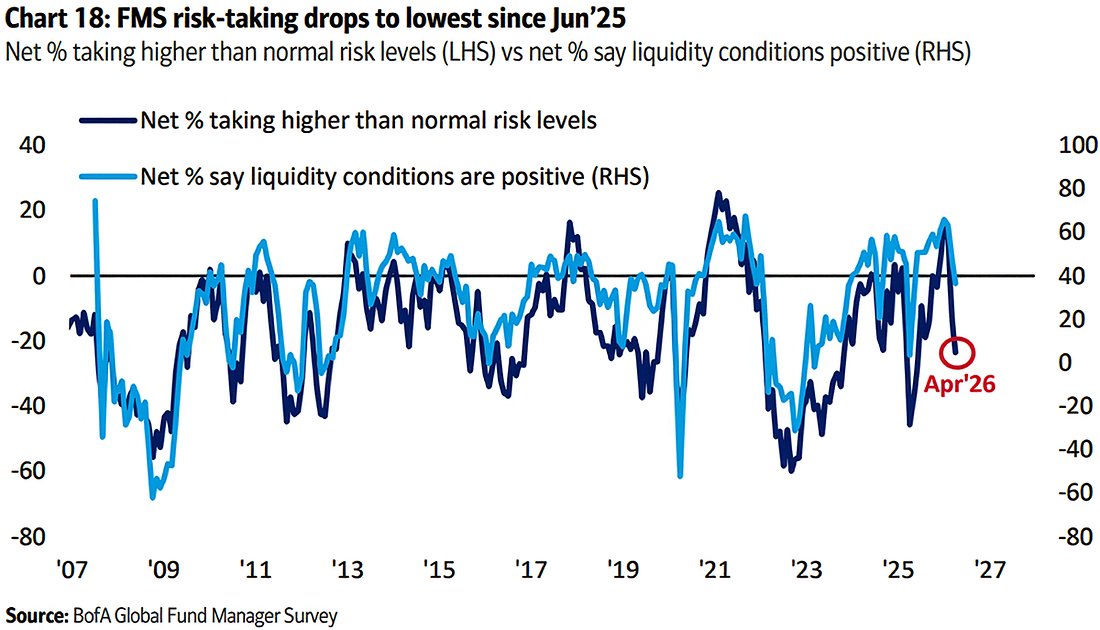
Liquidity, while still viewed as supportive by some, is clearly deteriorating, and risk-taking has dropped meaningfully, with managers now running below-normal exposure.
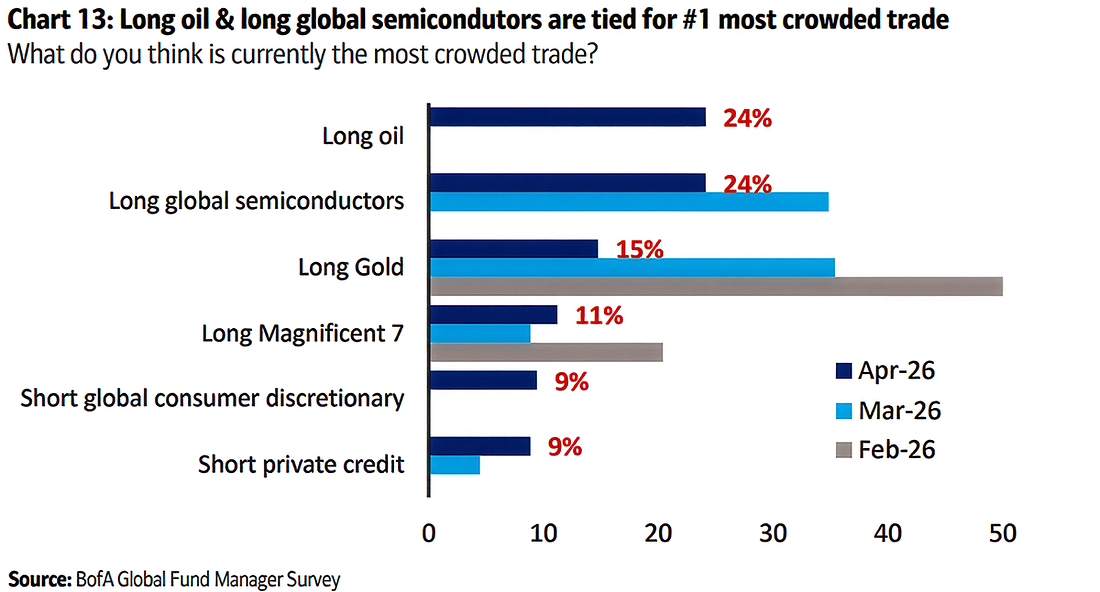
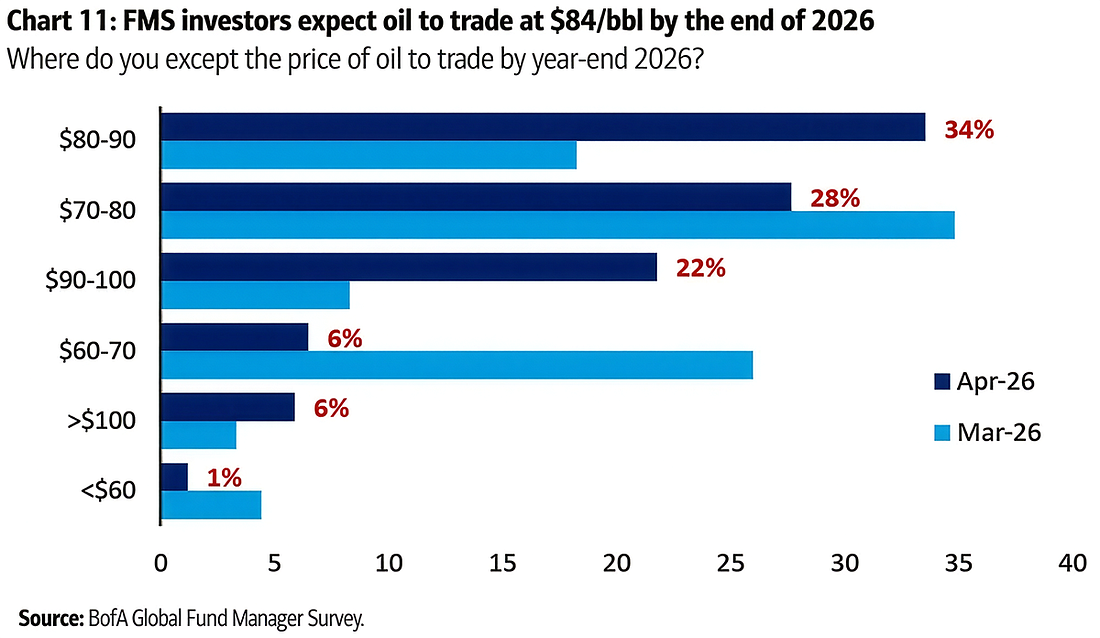
Market narratives are evolving accordingly. The most crowded trades are now “long oil” and “long global semiconductors,” replacing “long gold”. This shift is telling: oil is increasingly seen as a direct expression of the current macro environment, linking both inflation and growth risks more clearly than traditional defensive assets.
Energy expectations reinforce that view, with investors clustering around an oil price near $80–90 per barrel, with a median expectation near $84 per barrel.
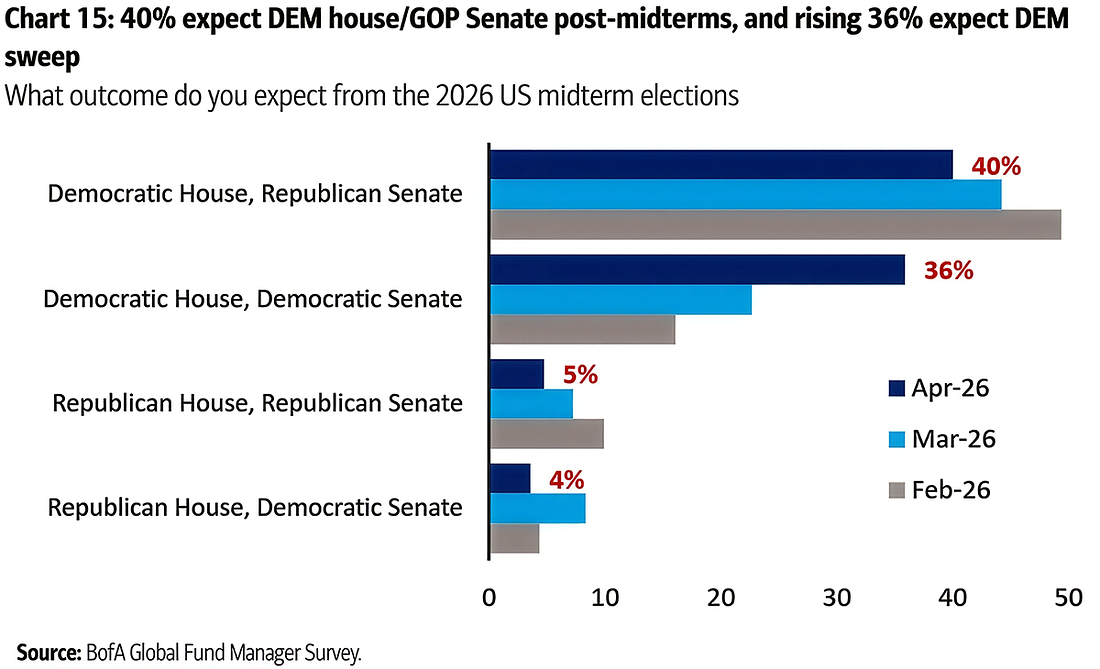
At the same time, the geopolitical backdrop is beginning to spill into political expectations. The prolonged U.S.–Iran conflict and rising gasoline prices appear to be weighing on sentiment around President Trump, with a growing share of respondents expecting a Democratic House and a potential broader political shift.
Taken together, the survey captures a market in transition. Expectations are deteriorating faster than positioning, leaving investors cautious—but not yet fully defensive. This creates a two-sided setup: downside risks persist if growth continues to weaken, but the bar for positive surprises is also falling, particularly if geopolitical tensions ease or inflation pressures moderate.
Against this backdrop, and as highlighted by BofA strategists, the environment may be “contrarian positive” for risk assets—especially if oil prices fall below the $84/bbl threshold, helping to ease inflation pressures. With sentiment weakening but positioning still elevated, markets remain vulnerable, yet increasingly sensitive to any improvement in the macro narrative.
Against this backdrop, and as highlighted by BofA strategists, the environment may be “contrarian positive” for risk assets—especially if oil prices fall below the $84/bbl threshold, helping to ease inflation pressures. With sentiment weakening but positioning still elevated, markets remain vulnerable, yet increasingly sensitive to any improvement in the macro narrative.
You can find more articles in our Telegram channel at https://t.me/atranicapital_eng
Or you can subscribe to our Weekly market update at https://atranicapital.substack.com/
Or you can subscribe to our Weekly market update at https://atranicapital.substack.com/
You can subscribe to new issues of the Magazine using the form below.