


Submit Request
Rest assured, your privacy is paramount to us. The information you provide will be treated with the utmost confidentiality and used exclusively for investment-related communications. We will never share your data with third parties without your consent.
Thank you for considering Atrani Capital for your investment needs. We look forward to connecting with you soon to explore the wealth of opportunities that can benefit us both.

Atrani Monthly magazine
Investors journey - 1, January 2026
Dear friends,
Happy New Year 2026, and welcome to the first issue of our monthly letter about the stock market. We will strive to find and write about interesting topics for you. We also invite you to take part—if you have any ideas, please write to us.
In this issue, we have three articles.
First one – Market forecasts for 2026
Second – Inside the ETF Industry’s Record Year
Third - Investors return gap in 2025
Let's start!
Market forecasts for 2026
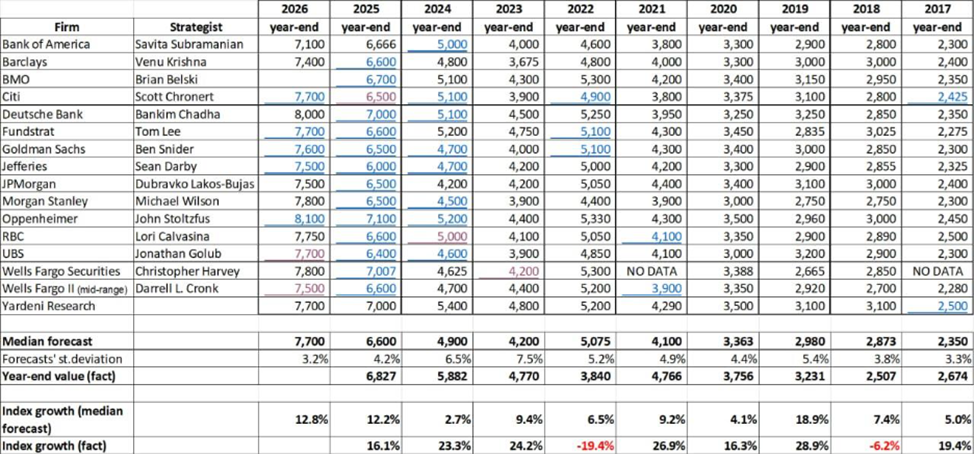
With 2026 approaching, I have once again updated my spreadsheet of Wall Street year-end targets for the S&P 500 (now covering 2016–2026). This year I also cleaned up the panel: I added Wells Fargo Investment Institute and removed Credit Suisse due to excessive missing data. The goals remain the same: (1) identify which firm has been the most accurate over time, and (2) test whether EPS is materially easier to forecast than the index level.
What Wall Street is forecasting for year-end 2026
The median 2026 target in my table is 7,700, which implies about +12.8% upside from the index’s current level of 6,827 (as of December 12, 2025). What stands out this year is how tight the consensus is: cross-forecaster dispersion is only ~3.2% (st.dev. in my panel), the lowest since 2016. The year-end 2026 range runs from 7,100 (Bank of America) to 8,100 (Oppenheimer), with several major houses clustered around 7,500–7,800.
The median 2026 target in my table is 7,700, which implies about +12.8% upside from the index’s current level of 6,827 (as of December 12, 2025). What stands out this year is how tight the consensus is: cross-forecaster dispersion is only ~3.2% (st.dev. in my panel), the lowest since 2016. The year-end 2026 range runs from 7,100 (Bank of America) to 8,100 (Oppenheimer), with several major houses clustered around 7,500–7,800.
Who has been most accurate historically
I evaluated which institution’s forecasts over the past 10 years came closest to the actual year-end S&P 500 level. To penalize large misses, I used root mean squared percentage error (RMSPE). The results:
Most accurate (lowest RMSPE):
• Bank of America: 13.72%
• Citi: 14.32%
• Yardeni Research: 14.50%
Least accurate (highest RMSPE):
• Wells Fargo Securities: 18.18%
• JPMorgan: 16.24%
• UBS: 16.08%
Which metric is forecast with less error?
I compared the median forecast deviation from the actual year-end S&P 500 level with the median deviation for EPS estimates. The median deviation for the S&P 500 forecast was 12.0%, while for EPS estimates it was materially lower at 6.3%.
This aligns with theory, particularly the Grinold–Kroner framework, which decomposes expected equity returns into building blocks. My key conclusion is that the primary driver of Wall Street’s index-level forecasting errors is the change in the valuation multiple (P/E). For example, in 2025 the median EPS estimate of 275 was only 0.9% below the actual figure. Yet the median S&P 500 forecast still missed by 3.3%—the smallest miss since 2016—largely because the P/E ratio barely moved over the year, which is a relatively rare outcome. Strategists predicted a P/E of 24.3x (median) versus an actual 24.6x.
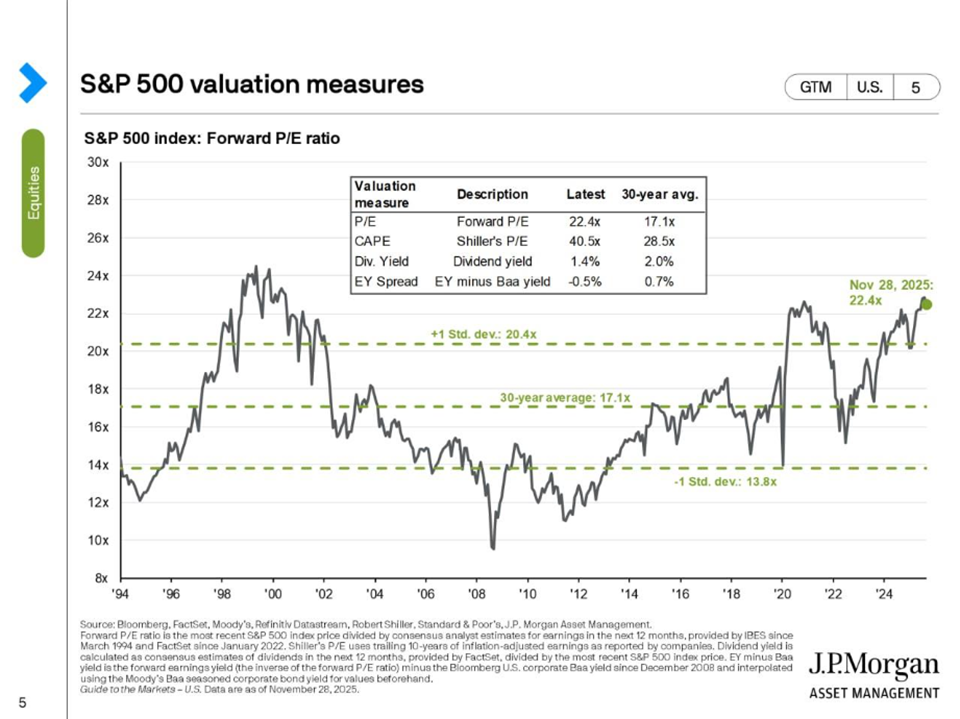
Looking ahead to 2026, analysts expect ~12% EPS growth and a modest P/E expansion to 24.9x. While the U.S. equity market still appears overvalued, the degree of “overheat” has eased over the past year: according to JPMorgan, the market is now 1.56 standard deviations above the 30-year average, down from 1.66 a year ago.
I evaluated which institution’s forecasts over the past 10 years came closest to the actual year-end S&P 500 level. To penalize large misses, I used root mean squared percentage error (RMSPE). The results:
Most accurate (lowest RMSPE):
• Bank of America: 13.72%
• Citi: 14.32%
• Yardeni Research: 14.50%
Least accurate (highest RMSPE):
• Wells Fargo Securities: 18.18%
• JPMorgan: 16.24%
• UBS: 16.08%
Which metric is forecast with less error?
I compared the median forecast deviation from the actual year-end S&P 500 level with the median deviation for EPS estimates. The median deviation for the S&P 500 forecast was 12.0%, while for EPS estimates it was materially lower at 6.3%.
This aligns with theory, particularly the Grinold–Kroner framework, which decomposes expected equity returns into building blocks. My key conclusion is that the primary driver of Wall Street’s index-level forecasting errors is the change in the valuation multiple (P/E). For example, in 2025 the median EPS estimate of 275 was only 0.9% below the actual figure. Yet the median S&P 500 forecast still missed by 3.3%—the smallest miss since 2016—largely because the P/E ratio barely moved over the year, which is a relatively rare outcome. Strategists predicted a P/E of 24.3x (median) versus an actual 24.6x.
Looking ahead to 2026, analysts expect ~12% EPS growth and a modest P/E expansion to 24.9x. While the U.S. equity market still appears overvalued, the degree of “overheat” has eased over the past year: according to JPMorgan, the market is now 1.56 standard deviations above the 30-year average, down from 1.66 a year ago.
Last December I was skeptical that the market could deliver another year of 20%+ gains, and I admit I was wrong. However, it does not change my broader point: over a 3–5 year horizon, a meaningful drawdown in the S&P 500 remains a plausible baseline scenario.
Disclaimer / methodology notes (updated)
1. Panel changes: added Wells Fargo Investment Institute, removed Credit Suisse due to gaps.
2. Missing values: some years/institutions have “NO DATA”; those observations are excluded where needed.
3. Consistency: Fundstrat history is kept consistent with Tom Lee’s lineage (as described in last year’s note)
Inside the ETF Industry’s Record Year: Growth, Concentration, and Fee Pressure
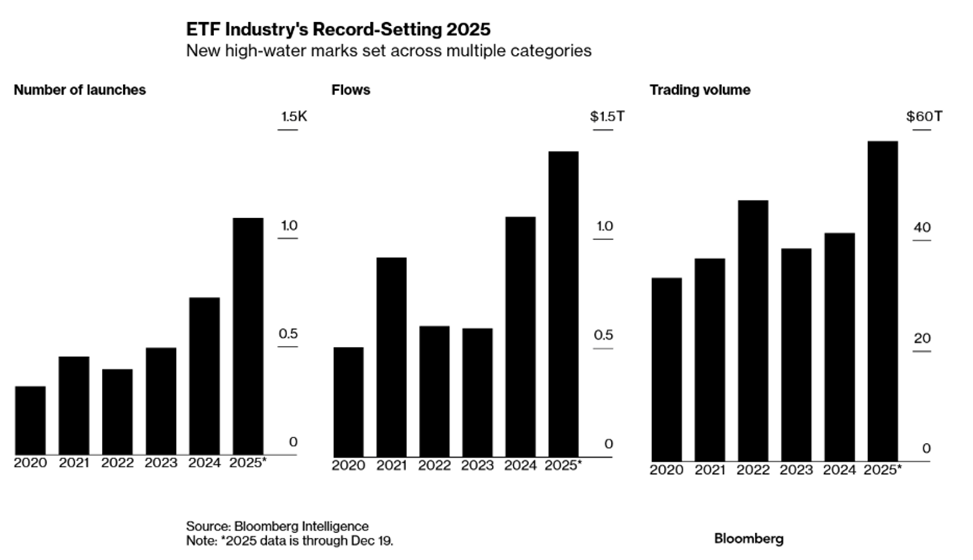
With less than two weeks remaining in the year, 2025 is shaping up as a record-breaking period for the US exchange-traded fund industry, which now manages more than $13 trillion in assets. US-listed ETFs have attracted approximately $1.4 trillion of net inflows year to date, decisively surpassing the previous annual record of $1.1 trillion set in 2024. Product activity has accelerated in parallel, with roughly 1,100 new ETFs launched, about 50% more than last year, while trading activity also reached new highs, with annual ETF trading volume approaching $60 trillion. According to Bloomberg Intelligence, the last time flows, launches, and trading volume all reached record levels in the same year was 2021, underscoring how exceptional 2025 has been for the industry.
Flows were supported by a steady pace of demand averaging close to $5 billion per day, with low-cost, index-tracking ETFs capturing the bulk of new capital. Actively managed ETFs also continued to expand their footprint, accounting for more than 30% of total inflows and roughly 84% of new product launches. This growth was underpinned by a third consecutive year of double-digit gains in the S&P 500. At the same time, industry strategists caution that a more volatile or challenging equity environment in 2026 could slow the pace of new launches—particularly among higher-risk and more speculative products—even if the structural case for ETFs and long-term adoption trends remain intact. As the market matures, the pace of growth may moderate, but innovation and demand for ETF structures are widely expected to persist beyond the extraordinary “triple record” conditions seen in 2025.
One of the most visible expressions of this innovation cycle has been the rapid rise of leveraged and options-based ETFs, especially single-stock products, which accounted for roughly 40% of launches during the year. These high-volatility instruments attracted significant retail interest despite well-documented long-term performance drag. The risks embedded in this segment became more apparent when extreme stock moves led to product failures, including the forced closure of GraniteShares’ 3x Short AMD Daily ETC earlier in October. Such episodes highlight potential stress points should market volatility increase further, but most analysts view them as a constraint on growth at the margin rather than a threat to the industry’s broader expansion.
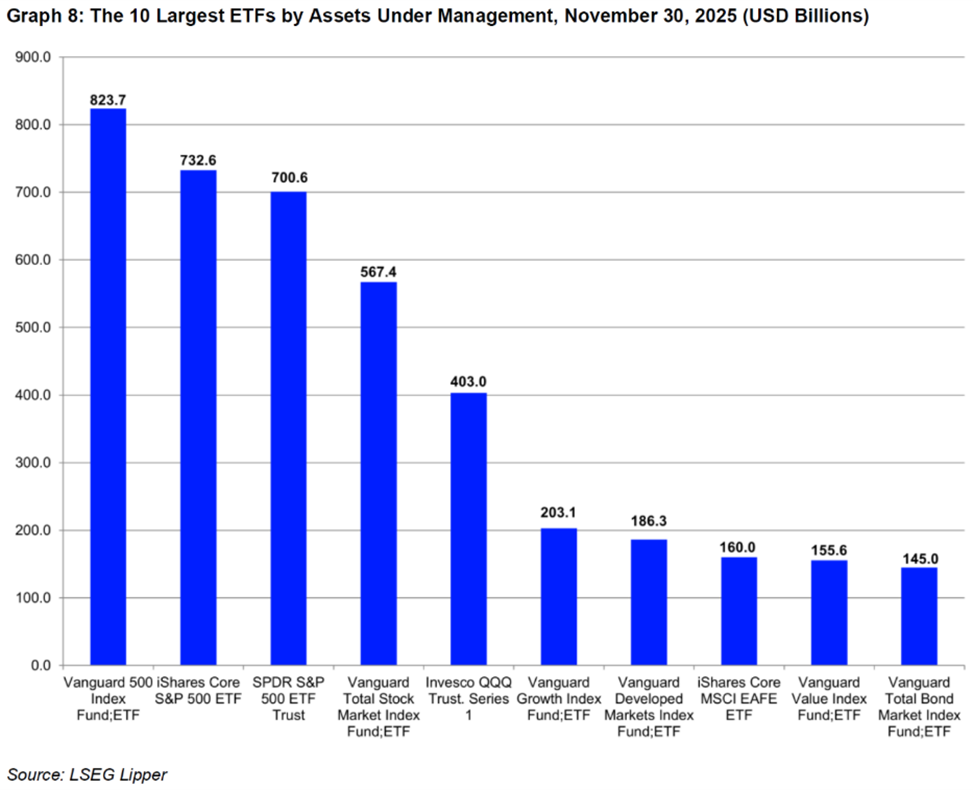
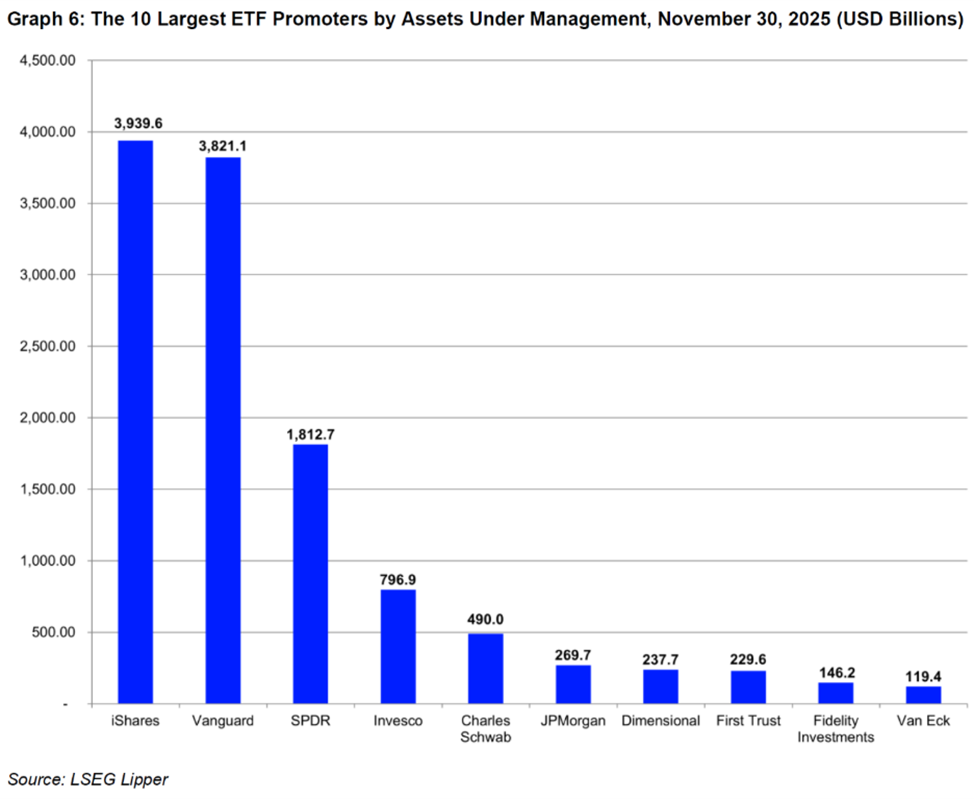
Beyond headline growth, however, the defining structural feature of the 2025 ETF boom has been extreme concentration, both at the fund and issuer level. According to LSEG data as of the end of November, only about 900 ETFs out of more than 4,700 listed in the US held assets above $1 billion, yet these funds controlled over 95% of total industry assets. Concentration at the very top is even more pronounced: the 10 largest ETFs alone accounted for roughly $4.1 trillion, or about 31% of total US ETF AUM. These dominant products are overwhelmingly broad, low-cost vehicles tracking US equity benchmarks—primarily S&P 500 and total-market exposures—highlighting investors’ continued preference for simplicity, liquidity, and scale even in a year marked by rapid product proliferation.
One of the most visible expressions of this innovation cycle has been the rapid rise of leveraged and options-based ETFs, especially single-stock products, which accounted for roughly 40% of launches during the year. These high-volatility instruments attracted significant retail interest despite well-documented long-term performance drag. The risks embedded in this segment became more apparent when extreme stock moves led to product failures, including the forced closure of GraniteShares’ 3x Short AMD Daily ETC earlier in October. Such episodes highlight potential stress points should market volatility increase further, but most analysts view them as a constraint on growth at the margin rather than a threat to the industry’s broader expansion.
Beyond headline growth, however, the defining structural feature of the 2025 ETF boom has been extreme concentration, both at the fund and issuer level. According to LSEG data as of the end of November, only about 900 ETFs out of more than 4,700 listed in the US held assets above $1 billion, yet these funds controlled over 95% of total industry assets. Concentration at the very top is even more pronounced: the 10 largest ETFs alone accounted for roughly $4.1 trillion, or about 31% of total US ETF AUM. These dominant products are overwhelmingly broad, low-cost vehicles tracking US equity benchmarks—primarily S&P 500 and total-market exposures—highlighting investors’ continued preference for simplicity, liquidity, and scale even in a year marked by rapid product proliferation.
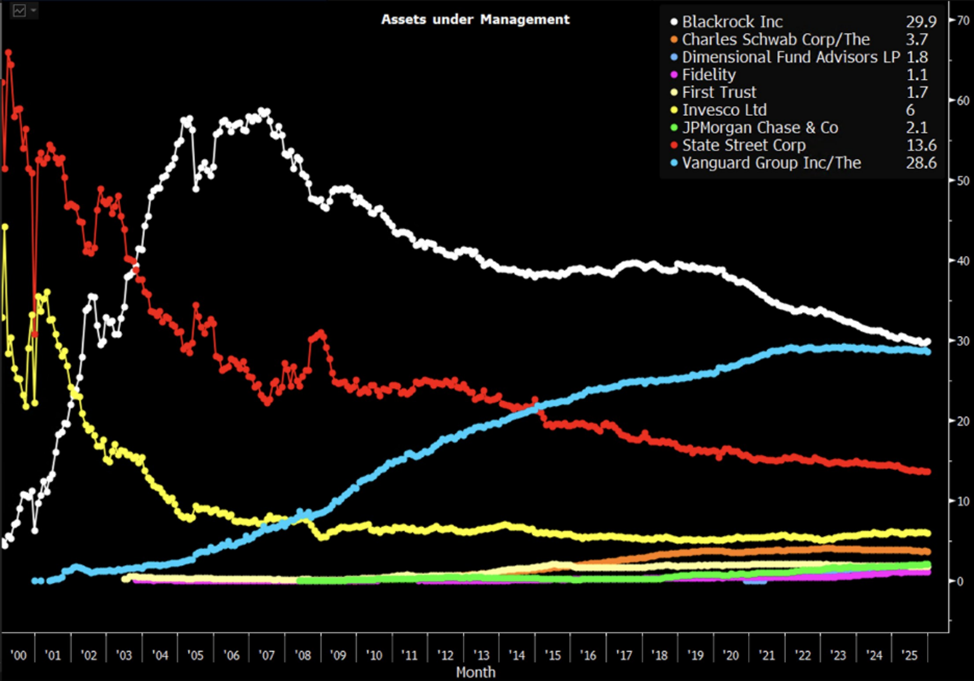
The same pattern is evident at the issuer level. BlackRock and Vanguard together controlled close to 60% of total US ETF assets in 2025, while the top 10 providers accounted for nearly 90% of industry AUM. Although hundreds of smaller issuers compete across niche strategies and thematic products, asset gathering remains heavily skewed toward a small group of incumbents with deep distribution networks, strong brand recognition, and flagship funds that increasingly function as default portfolio building blocks.
The gap between the two market leaders and the rest of the industry remains wide, reinforcing powerful scale advantages and raising meaningful barriers to competition in core beta exposures. Size allows dominant providers to operate flagship ETFs at razor-thin expense ratios, absorb operational costs across vast asset bases, and offer unmatched liquidity—advantages that are difficult for smaller issuers to replicate. As a result, newer or smaller competitors face a structural challenge: even when they offer similar index exposure, they struggle to match the combination of cost efficiency, trading depth, and brand recognition embedded in the largest funds. Over time, this dynamic further entrenches the incumbents’ position, concentrating asset growth in a narrow set of mega-funds and limiting the scope for meaningful competition in the most commoditized segments of the ETF market.
At a more granular level, 2025 also marked a clear and increasingly important shift toward lower-cost vehicles even within identical benchmark exposures. As core equity exposure has become fully commoditized and tracking differences between providers are negligible, expense ratios have emerged as one of the few remaining variables investors can directly control. Even small fee gaps—measured in single-digit basis points—compound into a meaningful performance drag over long holding periods when applied to large, long-term allocations. This dynamic became increasingly visible in 2025 as investors grew more discerning in their choice of core beta instruments.
Among the largest broad-market US equity ETFs, this shift translated into starkly divergent flows. Over the first eleven months of the year, the Vanguard S&P 500 ETF attracted approximately $125 billion of net inflows, while the iShares Core S&P 500 ETF gathered $48.6 billion. Vanguard’s Total Stock Market ETF added another $33.2 billion, reinforcing the dominance of ultra-low-cost products with expense ratios around 0.03% as long-term portfolio anchors.
Among the largest broad-market US equity ETFs, this shift translated into starkly divergent flows. Over the first eleven months of the year, the Vanguard S&P 500 ETF attracted approximately $125 billion of net inflows, while the iShares Core S&P 500 ETF gathered $48.6 billion. Vanguard’s Total Stock Market ETF added another $33.2 billion, reinforcing the dominance of ultra-low-cost products with expense ratios around 0.03% as long-term portfolio anchors.
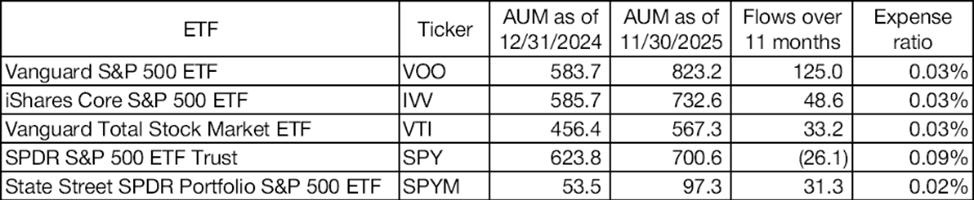
By contrast, the SPDR S&P 500 ETF Trust experienced net outflows of $26.1 billion over the same period, despite tracking the same index and remaining one of the most liquid securities in global markets. The divergence is particularly notable given that State Street offers a lower-cost alternative within its own lineup. The SPDR Portfolio S&P 500 ETF, with an expense ratio of just 0.02% versus SPY’s roughly 0.09%, attracted $31.3 billion of net inflows—more than offsetting the losses from SPY. This pattern suggests that investors are no longer indifferent to cost even at the very top of the ETF hierarchy: while SPY remains unmatched in trading liquidity and continues to play a central role in derivatives, hedging, and tactical trading strategies, fees are increasingly decisive when competing products are used as long-term holdings.
You can find more articles in our Telegram channel at https://t.me/atranicapital_eng
You can find more articles in our Telegram channel at https://t.me/atranicapital_eng
Investors return gap
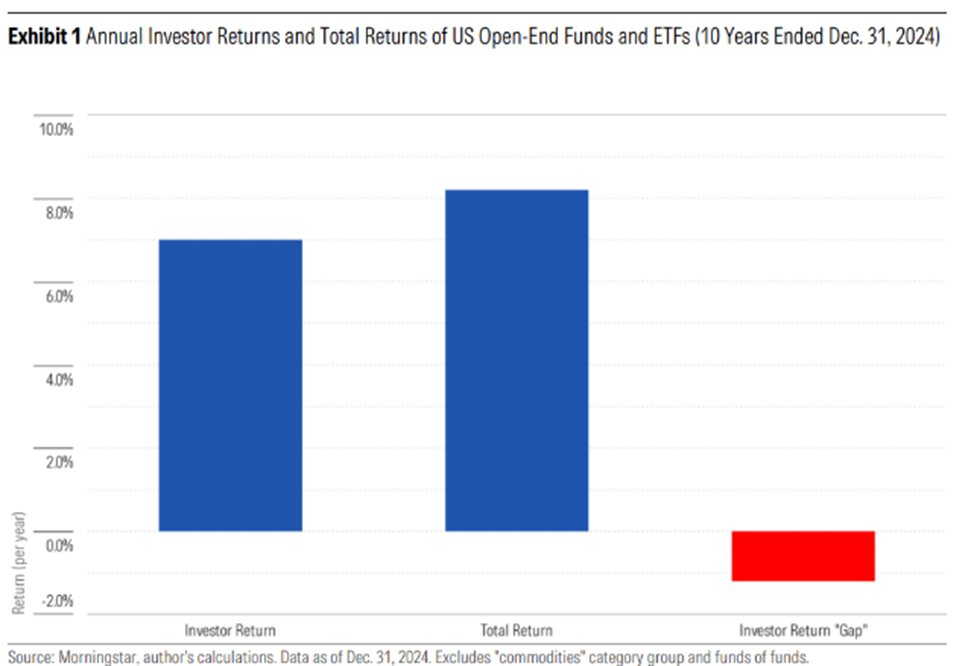
A long-term Morningstar study on investor returns versus the broader market estimate the average dollar invested in US mutual funds and exchange-traded funds earned 7.0% per year over the 10 years ended Dec. 31, 2024 (“investor return”). That’s about 1.2 percentage points per year less than these funds’ 8.2% aggregate annual total return (“total return”) over that span assuming an initial lump-sum purchase. That 1.2 percentage point “investor return gap," which is explained by the timing and magnitude of investors' purchases and sales of fund shares during the 10-year period, is equivalent to around 15% of the funds’ aggregate total return.
Most of the damage came from bad market timing. Investors try to guess market bottoms and tops and end up losing as a result, often finding themselves out of the market at the crucial moment.
Most of the damage came from bad market timing. Investors try to guess market bottoms and tops and end up losing as a result, often finding themselves out of the market at the crucial moment.
In future issues, we will talk more about common behavioral mistakes investors make in the stock market.
That’s all friends. Thank you for your attention. We hope you liked our first journal. And don’t hesitate to invite your friends to read our journal.
Igor Rotor and
Atrani Capital team.
That’s all friends. Thank you for your attention. We hope you liked our first journal. And don’t hesitate to invite your friends to read our journal.
Igor Rotor and
Atrani Capital team.
You can subscribe to new issues of the Magazine using the form below.